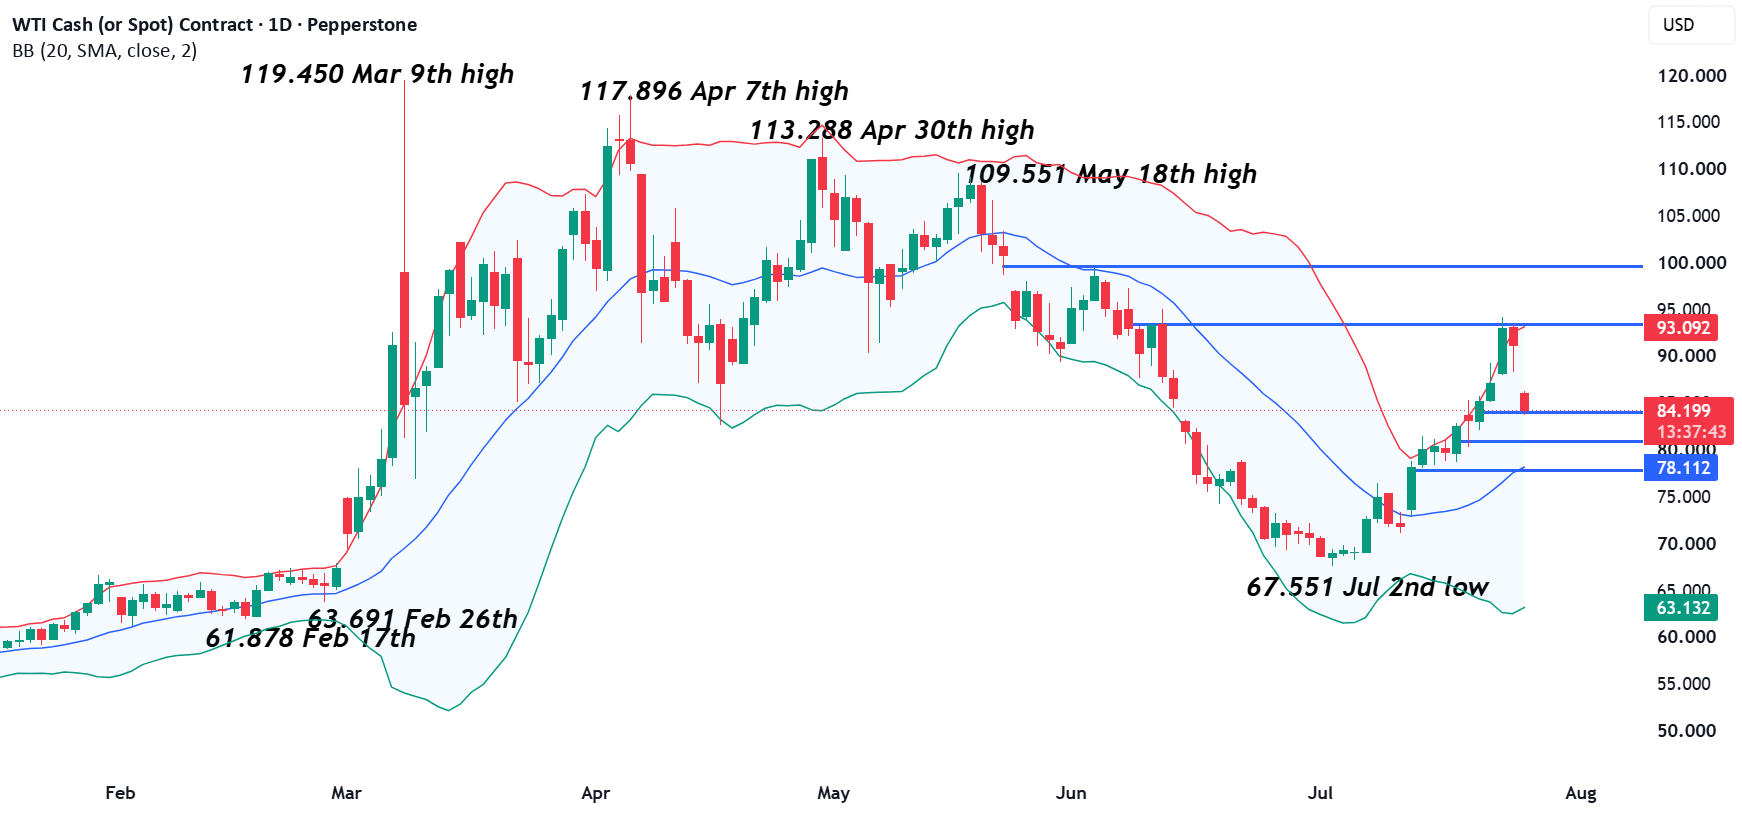
However, then on Friday the backdrop changed, rumours of the possibility for mediated talks between the US and Iran started to circulate, pulling prices back lower again, to close the week at 91.106. Tensions eased further over the weekend with the US pausing strikes for 2 consecutive days, resulting in Tehran commenting it would also halt its retaliation, while also entering talks with officials from Oman in an attempt to resolve shipping issues through the Strait of Hormuz. These events combined to produce a gap open move lower in Oil (WTI) on Monday, which extended to touch a low of 83.649 before some fresh buyers were found taking prices back to 84.10 at time of writing (0730 BST).
Looking forward, the Iran conflict stands at a potential crossroads, with traders awaiting the next crucial news updates on whether the shift is toward deescalation and talks or a resumption of attacks. In this environment assessing the technical backdrop can prove to be useful for future trade planning.
Technical Update: A Question of Retracement Resistance Versus Retracement Support
With geo-political concerns increasing last week, the price of Crude Oil (WTI) rallied sharply, following what was a 43% decline seen between the March 9th high (119.45) and July 2nd low (67.551). As the chart below shows this latest phase of price strength tested what is potentially an important resistance level at 93.352. This is equal to the 50% Fibonacci retracement of the March/July decline.
Traders may be monitoring how this 93.352 resistance level is defended on a closing basis in an attempt to gauge if the current strength can continue to higher levels, or if it proves to be an important resistance, from which fresh declines may emerge again.
Potential Resistance Levels:
As stated above, it appears that the 93.352 retracement represents the first key resistance level this week and how it is defended on a closing basis may be the catalyst for the next directional move for Oil (WTI). Closing breaks above 93.352 could lead to a further period of price strength.
If closes are seen above 93.352 this week, it could shift focus towards 99.480, which is a level equal to the 61.8% Fibonacci retracement. A break above this level could open scope towards 109.551, the May 18th session high.
Potential Support Levels:
While the retracement resistance at 93.352 continues to cap prices on a closing basis the risk for a resumption of downside themes remains a possibility.
Weekend developments in the Middle East have already seen weakness reemerge to start the new week, with prices experiencing a gap lower at the 86.031 open and then an extended fall to a low of 83.649, before recovering.
This fall may mean the focus for traders could already be shifting to potential support at 84.055, which is the 38.2% Fibonacci retracement of the July price strength.
A closing break below 84.055 could open scope for further downside pressure toward the next support at 80.912 (50% retracement level). A closing break below 80.912 may then see the risks for an extension of the price weakness increase toward 77.770, which is the deeper 61.8% level.
The material provided here has not been prepared accordance with legal requirements designed to promote the independence of investment research and as such is considered to be a marketing communication. Whilst it is not subject to any prohibition on dealing ahead of the dissemination of investment research, we will not seek to take any advantage before providing it to our clients.
Pepperstone doesn’t represent that the material provided here is accurate, current or complete, and therefore shouldn’t be relied upon as such. The information, whether from a third party or not, isn’t to be considered as a recommendation; or an offer to buy or sell; or the solicitation of an offer to buy or sell any security, financial product or instrument; or to participate in any particular trading strategy. It does not take into account readers’ financial situation or investment objectives. We advise any readers of this content to seek their own advice. Without the approval of Pepperstone, reproduction or redistribution of this information isn’t permitted.